
Overview
The major goal of the current research experiments is to develop methodologies and cross-validation for crop biophysical parameters (LAI, biomass) estimations methodologies, and seasonal crop inventory maps generation. We are also actively involved in investigating improved vegetation indices for crop growth monitoring. The current products require mainly the quad- and compact-pol Synthetic Aperture Radar (SAR) observations along with in-situ measurements.
Project Objectives
Mapping Agricultural Areas
Operational Implementation Plan
The test site covers an area of 25×25 km2 and is characterized by major annual crops viz., rice (Oriza sativa), cotton and sugarcane. The flat topography and the agricultural dominance of the study area make it useful for crop-related studies using SAR data sets. Crop inventory mapping is one of the essential tasks for our study, which is required to establish the estimates of crop production. As such, the accurate crop classification at pixel or parcel level is of significant interest to the agriculture community.
We utilize the SAR derived polarimetric parameters as feature set for classification. In recent years, polarimetric data have been widely used for crop mapping and monitoring, and several experiments have underscored the potential of land cover and land use classification using SAR data. Our objective of this research is to assess the classification accuracy result for day wise and time series data over the test sites, using supervised classifiers (SVM and random forest).
In addition to backscatter intensities (HH, HV and VV channels), the polarimetric features (e.g., Kennaugh matrix elements, scattering power decomposition parameters etc.) are used as feature dataset. In first phase, we majorly focus on C-band RADARSAT-2 quad-pol data sets for crop classification. Later, with the availability of multi-frequency (TerraSAR-X and ALOS-2 L-band) data sets, we incorporate a multi-frequency classification approach. Also, we compare several classification approach for multi-temporal classification. A schematic diagram of a multi-temporal classification is presented in Figure 1.
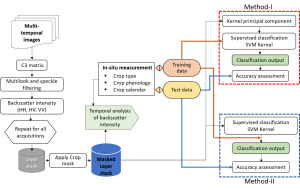
Figure 1. The process fowchart of crop classi fication based on KPCA+SVM and SVM method. [1]
References:
[1] D. Mandal, V. Kumar, Y. S. Rao (2020), “An assessment of temporal RADARSAT-2 SAR data for crop classification using KPCA based support vector machine”, Geocarto International, 2020, DOI: 10.1080/10106049.2020.1783577
Scale
Regional
Estimating Crop Conditions
Operational Implementation Plan
Rice growth monitoring using Synthetic Aperture Radar (SAR) is recognized as a promising approach for tracking the development of this important crop. Accurate spatio-temporal information of rice inventories is required for water resource management, production risk occurrence, and yield forecasting. This research investigates the potential of the radar derived vegetation indices for monitoring rice growth at different phenological stages. Polarimetric SAR can provide a rich source of data to track temporal dynamics of vegetation conditions. Similar to spectral indices that are well established in optical remote sensing, a vegetation index derived from SAR data could be an alternative, especially for crop growth monitoring during periods of cloud cover.
We focus our experiment to implement recently developed three radar vegetation indices (Figure 2):
- Generalized volume scattering model based Radar Vegetation Index (GRVI) [1]
- Compact-pol Radar Vegetation Index (CpRVI) [2]
- Dual-pol Radar Vegetation Index (DpRVI) [3]
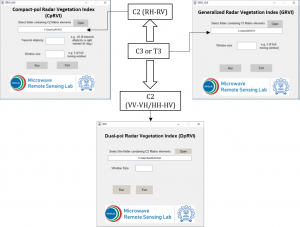
Figure 2. Radar vegetation indices
References:
[1] D. Mandal, V. Kumar, D. Ratha, J. M. Lopez-Sanchez, A. Bhattacharya, H. McNairn, Y. S. Rao, K.V. Ramana,”Assessment of rice growth conditions in a semi-arid region of India using the Generalized Radar Vegetation Index derived from RADARSAT-2 polarimetric SAR data,” Remote Sensing of Environment, Vol. 237, 111561, 2020, DOI:10.1016/j.rse.2019.111561.
[2] D. Mandal, D. Ratha, A. Bhattacharya, V. Kumar, H. McNairn, Y. S. Rao, A. C. Frery ,” A Radar Vegetation Index for Crop Monitoring Using Compact Polarimetric SAR Data,” IEEE Transactions on Geoscience and Remote Sensing, 2020, DOI: 10.1109/TGRS.2020.2976661.
[3] D. Mandal, V. Kumar, D. Ratha, S. Dey, A. Bhattacharya, J. M. Lopez-Sanchez, H. McNairn, Y. S. Rao, “Dual Polarimetric Radar Vegetation Index for Crop Growth Monitoring Using Sentinel-1 SAR Data,” Remote Sensing of Environment, 2020. (In press)
Crop Conditions
- growth status
Measuring Phenological Events
Operational Implementation Plan
Variations in crop phenological stages can be characterized by Synthetic Aperture Radar (SAR) data due to its high sensitivity to the dielectric and geometrical structure of the canopy. We utilize novel PolSAR scattering components and clustering algorithms to classify phenological stages of rice. The clustering of rice phenological stages via Cloude and Pottier’s H/alpha is first proposed by Lopez-Sanchez et al. [1]. However, we introduce a new H\theta plane (unified framework for quad and compact-pol SAR data [2]) to characterize rice phenological stages. Later these new parameters would be used for phenological stages classification.
In addition, for dual-pol SAR data, we utilize a temporal data set and clustering algorithm to identify transplantation stage of rice over the region using Sen4Rice processing chain [3].
References:
[1] Lopez-Sanchez, J.M., Vicente-Guijalba, F., Ballester-Berman, J.D. and Cloude, S.R., 2012. Polarimetric response of rice fields at C-band: Analysis and phenology retrieval. IEEE Transactions on Geoscience and Remote Sensing, 52(5), pp.2977-2993.
[2] S. Dey, D. mandal, D. Ratha, J.M. Lopez-Sanchez, A. Bhattacharya, H.McNairn, Y. S. Rao, “Novel Clustering Schemes for Full and Compact Polarimetric SAR Data: A Case Study for Rice Monitoring”, ISPRS Journal of Photogrammetry and Remote Sensing (Under review).
[3] Mandal, D., Kumar, V., Bhattacharya, A., Rao, Y.S., Siqueira, P. and Bera, S., 2018. Sen4Rice: A processing chain for differentiating early and late transplanted rice using time-series Sentinel-1 SAR data with Google Earth engine. IEEE Geoscience and Remote Sensing Letters, 15(12), pp.1947-1951.
Phenological Events
- Seedling
- Vegetative Growth
- Fruit Development
- Harvest
Estimation of Biophysical Variables
Operational Implementation Plan
Retrieval of crop biophysical parameter is one of the major goal for the current experiment. High spatio-temporal resolution and wide spatial coverage provided by EO satellite data are key inputs for operational crop monitoring. In Synthetic Aperture Radar (SAR) applications, a semi-empirical model (viz., Water Cloud Model (WCM) [1]) is often used to estimate vegetation descriptors individually from quad and dual-pol data. Plant Area Index (PAI) and wet biomass (W) are used as the vegetation descriptors in the WCM. The performance of the inversion approach is evaluated with in-situ measurements collected over the test site using RADARSAT-2 and Sentinel-1 data. We also explore compact-pol (simulated Radarsat Constellation Mission –RCM data) for biophysical parameter estimation. With the availability of temporal data (multi-year) we can perform the cross-validation of model estimation and its transferability.
References:
[1] Attema, E.P.W. and Ulaby, F.T., 1978. Vegetation modeled as a water cloud. Radio science, 13(2), pp.357-364.
Biophysical Variables
- Vegetation Indices (NDVI, EVI, SAVI, etc.)
- LAI (Leaf Area Index)
- Biomass
- LAIeff
Site Description
| Landscape Topography | The test site is situated in Krishna river delta, and thereby have a flat topography with very gentle slope. |
|---|---|
| Typical Field Size | Average field size of the test site is 100m x 100m. |
| Climatic Zone | Tropics, warm |
| Major Crops and Calendars | Rice (Normal): Cotton (Normal): Sugar cane (Normal): |
| Soil Type & Texture | Inorganic:
|
| Soil Drainage Class | |
| Irrigation Infrastructure | Irrigation canal |
| Other Site Details | The Vijayawada test site covers the Krishna and Guntur districts in the state of Andhra Pradesh, India. The test site covers an area of approx. 25×25 km2 and is characterized by three major annual crops–rice, sugarcane, and cotton. These crops are grown in two distinct seasons– monsoon or kharif (June-November) and winter or rabi (December-March). In particular, two major rice cultivation techniques, i.e., transplanted rice (TR) and direct seeded rice (DSR) are being practiced during the kharif season. In traditional farming, rice is primarily grown by transplanting seedlings into flooded puddled fields. The TR cultivation requires large volumes of water (approx. 150 cm of total irrigation water) for puddling and further maintenance of standing-water conditions. Alternatively, the DSR cultivation is being promoted in this region (Figure 3), which includes alternate wetting and drying instead of a persistent standing-water condition. The DSR method of cultivation reduces water consumption by approximately 30% by eliminating the nursery raising, puddling, transplanting, and initial standing-water condition during the early tillering stage. 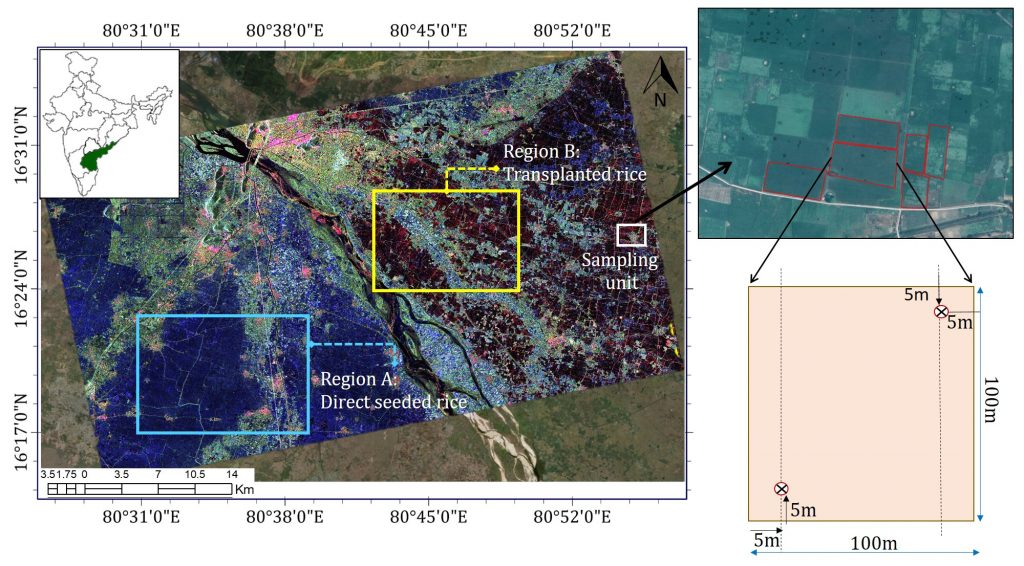 Figure 3. The JECAM-Vijayawada (Andhra Pradesh) India test site with a RADARSAT-2 PauliRGB image of 29th July 2018. Two distinct regions for direct seeded rice (Region A in cyan box) and transplanted rice (Region B in yellow box) are marked with in the test area. A layout of a sampling unit (white box) is highlighted at the right. |
In Situ Observations
PAI
- Crop Type(s): Rice, Sugar cane
- Collection Protocol:
During the campaign, in-situ measurements were collected of crops and soil for 75 agricultural fields. The nominal size of each field is around 100mx100m. In each field, vegetation sampling was conducted at two points (Figure 1) corresponding to the soil sampling locations. The PAI was estimated from photographs using the concept of hemispherical digital photography. During each of the measurement day, ten photos were taken along two transects which are separated by 2 m in each sampling point, using a wide-angle lens mounted on a digital camera. These photos record the geometry of the plant canopy obstructing the field of view against the soil surface. All images were post-processed using the CanEYE software [1] to provide an estimate of PAI.
References:
[1] INRA (2017) CAN-EYE. https://www6.paca.inra.fr/can-eye
- Frequency: 24 days
Wet biomass
- Crop Type(s): Rice
- Collection Protocol:
Above ground biomass is cut a 50cmx50cm area and weighted with a digital balance to get an estimate of wet biomass.
- Frequency: 24
Phenological stages
- Crop Type(s): Rice
- Collection Protocol:
The phenological growth of rice is usually expressed with three major stages: vegetative, reproductive, and maturation or ripening. Each of these stages has particular morphological changes and variations in the biophysical parameters. These phenological developments were indicated in terms of a quantitative measure using the BBCH (Biologische Bundesanstalt Bundessortenamt und CHemische Industrie) scale by visual inspection.
- Frequency: 24
Soil moisture
- Crop Type(s): Rice, Sugar cane
- Collection Protocol:
In each sampling field, soil moisture was measured at two sampling locations, arranged in two parallel transects along the row direction. Each transect was separated by approximately 80m. Soil moisture was measured at each point using a theta-probe. However, it is important to note that soil underlying the rice canopy was saturated during most of the growing season due to frequent irrigation and rainfall events.
- Frequency: 24
EO Data
Optical Data Requirements
SAR Data Requirements
Passive Microwave Data Requirements
Thermal Data Requirements
Results
Documents and Files
PAI_estimation_WCM-JECAM-India.pdf JECAMSiteProgress_India_Vijayawada_2020.pdf JECAMSiteProgress_India_Vijayawada_2018.pdfLinks to paper
- D. Mandal, V. Kumar, D. Ratha, J. M. Lopez-Sanchez, A. Bhattacharya, H. McNairn, Y. S. Rao, and K.V. Ramana, “Assessment of rice growth conditions in a semi-arid region of India using the Generalized Radar Vegetation Index derived from RADARSAT-2 polarimetric SAR data. ” Remote Sensing of Environment, Vol 237, 2020, 111561, DOI: 10.1016/j.rse.2019.111561.
- S. Dey, D. Mandal, L. Dingle Robertson, B. Banerjee, V. Kumar, H. McNairn, A. Bhattacharya, Y.S. Rao, “In-Season Crop Classification Using Elements of the Kennaugh Matrix Derived from Polarimetric RADARSAT-2 SAR Data,” International Journal of Applied Earth Observations and Geoinformation, Vol 88, 2020, 102059.
- V. Kumar, D. Mandal, A. Bhattacharya, Y. S. Rao, “Crop characterization using an improved scattering power decomposition technique for compact polarimetric SAR data,” International Journal of Applied Earth Observation and Geoinformation, Vol.88, 2020, 102052, DOI: 10.1016/j.jag.2020.102052.
- D. Mandal, V. Kumar, Y. S. Rao, A. Bhattacharya, K. V. Ramana, “Experimental Field Campaigns at Vijayawada Test Site,” Microwave Remote Sensing Lab, Indian Institute of Technology Bombay, India, Tech. Rep. MRS2019TR02, 2019. doi: 10.17605/OSF.IO/DN3E8
Project Reports
Study Team
Team Leader
Centre of Studies in Resources Engineering (CSRE),
Indian Institute of Technology Bombay,
Powai, Mumbai - 400 076 India
Other Team Members